Visit the NOAA
Coastal Services Center Historical Hurricane Tracks web site to learn about
historical tropical cyclones occurring in different areas located throughout
the North Atlantic, Caribbean, Gulf of Mexico and East-Central North Pacific
Basins.
 The web site provides information about
U.S. coastal county population versus hurricane strikes as well as links
to various Internet resources focusing on tropical cyclones. The interactive
mapping application allows you to search the National Hurricane Center historical
tropical cyclone database and graphically display storms affecting
your area since 1851.
The web site provides information about
U.S. coastal county population versus hurricane strikes as well as links
to various Internet resources focusing on tropical cyclones. The interactive
mapping application allows you to search the National Hurricane Center historical
tropical cyclone database and graphically display storms affecting
your area since 1851.
-
GALVESTON 1900
-
ATLANTIC-GULF
1919
-
MIAMI 1926
-
SAN FELIPE-OKEECHOBEE
1928
-
FLORIDA KEYS LABOR
DAY 1935
-
NEW ENGLAND
1938
-
GREAT ATLANTIC
1944
-
CAROL AND EDNA
1954
-
HAZEL 1954
-
CONNIE AND DIANE
1955
-
AUDREY 1957
-
DONNA 1960
-
CAMILLE 1969
-
AGNES 1972
-
TROPICAL STORM
CLAUDETTE 1979
-
ALICIA 1983
-
GILBERT 1988
-
HUGO 1989
-
ANDREW 1992
-
TROPICAL STORM
ALBERTO 1994
-
OPAL 1995
-
MITCH 1998
-
FLOYD 1999
-
KEITH 2000
-
TROPICAL STORM
ALLISON 2001
-
IRIS 2001
-
ISABEL 2003
-
CHARLEY 2004
-
FRANCES 2004
-
IVAN 2004
-
JEANNE 2004
Galveston Hurricane
1900
 This killer weather system was first detected over
the tropical Atlantic on August 27. While the history of the track and intensity
is not fully known, the system reached Cuba as a tropical storm on September
3 and moved into the southeastern Gulf of Mexico on the 5th. A general
west-northwestward motion occurred over the Gulf accompanied by rapid
intensification. By the time the storm reached the Texas coast south of Galveston
late on September 8, it was a Category 4 hurricane. After landfall, the cyclone
turned northward through the Great Plains. It became extratropical and turned
east-northeastward on September 11, passing across the Great Lakes, New England,
and southeastern Canada. It was last spotted over the north Atlantic on September
15.
This killer weather system was first detected over
the tropical Atlantic on August 27. While the history of the track and intensity
is not fully known, the system reached Cuba as a tropical storm on September
3 and moved into the southeastern Gulf of Mexico on the 5th. A general
west-northwestward motion occurred over the Gulf accompanied by rapid
intensification. By the time the storm reached the Texas coast south of Galveston
late on September 8, it was a Category 4 hurricane. After landfall, the cyclone
turned northward through the Great Plains. It became extratropical and turned
east-northeastward on September 11, passing across the Great Lakes, New England,
and southeastern Canada. It was last spotted over the north Atlantic on September
15.
This hurricane
was the deadliest weather disaster in United States history.
Storm
tides of 8 to 15 ft inundated the whole of Galveston Island, as well
as other portions of the nearby Texas coast. These tides were largely responsible
for the 8,000 deaths (estimates range from 6,000 to 12,000) attributed to
the storm. The damage to property was estimated at $30 million.
For an
interactive
map of the Galveston Hurricane visit the
NOAA Coastal Services Center.
Back
to the top
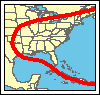
Atlantic-Gulf Hurricane
1919
 This fearsome cyclone was first detected near the Lesser
Antilles on September 2. It moved generally west-northwestward for several
days, passing near the Dominican Republic on September 4 and into the
southeastern Bahamas on the 5th and 6th. At that time it became a hurricane.
A westward turn on September 7 took the center across the central Bahamas
on the 7th and 8th and into the Straits of Florida on the 9th. The now large
hurricane was of Category 4 intensity as the eye passed just south of Key
West, Florida and the Dry Tortugas on September 10. A continued west to
west-northwestward motion brought the center to the Texas coast south of
Corpus Christi as a Category 3 hurricane on September 14. The cyclone dissipated
over northern Mexico and southern Texas the next day.
This fearsome cyclone was first detected near the Lesser
Antilles on September 2. It moved generally west-northwestward for several
days, passing near the Dominican Republic on September 4 and into the
southeastern Bahamas on the 5th and 6th. At that time it became a hurricane.
A westward turn on September 7 took the center across the central Bahamas
on the 7th and 8th and into the Straits of Florida on the 9th. The now large
hurricane was of Category 4 intensity as the eye passed just south of Key
West, Florida and the Dry Tortugas on September 10. A continued west to
west-northwestward motion brought the center to the Texas coast south of
Corpus Christi as a Category 3 hurricane on September 14. The cyclone dissipated
over northern Mexico and southern Texas the next day.
Although
hurricane-force winds occurred over the Florida Keys and the central and
south Texas coast, no reliable wind measurements are available from near
the center. A storm surge of up to 12 ft inundated Corpus Christ, Texas causing
major damage to the coastal areas. A ship moored near the Dry Tortugas measured
a pressure of 27.37 inches as the center passed, and based on this, the storm
is ranked as the third most intense to hit the United States.
The death toll
was estimated at 600 to 900 people. Of these, more than 500 were lost on
ten ships that either sunk or were reported missing. Damage in the United
States was estimated at $22 million.
For an
interactive
map of the Atlantic-Gulf Hurricane visit the
NOAA Coastal Services
Center.
Back
to the top
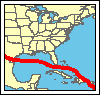
Great Miami Hurricane
1926
 The "Great Miami" Hurricane was first spotted as a tropical wave located
1,000 miles east of the Lesser Antilles on September 11th. The system moved
quickly westward and intensified to hurricane strength as it moved to the
north of Puerto Rico on the 15th. Winds were reported to be nearly 150 mph
as the hurricane passed over the Turks Islands on the 16th and through the
Bahamas on the 17th. Little in the way of meteorological information on the
approaching hurricane was available to the Weather Bureau in Miami. As a
result, hurricane warnings were not issued until midnight on September 18th,
which gave the booming population of South Florida little notice of the impending
disaster.
The "Great Miami" Hurricane was first spotted as a tropical wave located
1,000 miles east of the Lesser Antilles on September 11th. The system moved
quickly westward and intensified to hurricane strength as it moved to the
north of Puerto Rico on the 15th. Winds were reported to be nearly 150 mph
as the hurricane passed over the Turks Islands on the 16th and through the
Bahamas on the 17th. Little in the way of meteorological information on the
approaching hurricane was available to the Weather Bureau in Miami. As a
result, hurricane warnings were not issued until midnight on September 18th,
which gave the booming population of South Florida little notice of the impending
disaster.
The Category 4
hurricane's eye moved directly over Miami Beach and downtown Miami during
the morning hours of the 18th. This cyclone produced the highest sustained
winds ever recorded in the United States at the time, and the barometric
pressure fell to 27.61 inches as the eye passed over Miami. A storm surge
of nearly 15 feet was reported in Coconut Grove. Many casualties resulted
as people ventured outdoors during the half-hour lull in the storm as the
eye passed overhead. Most residents, having not experienced a hurricane,
believed that the storm had passed during the lull. They were suddenly trapped
and exposed to the eastern half of the hurricane shortly thereafter. Every
building in the downtown district of Miami was damaged or destroyed. The
town of Moore Haven on the south side of Lake Okeechobee was completely flooded
by lake surge from the hurricane. Hundreds of people in Moore Haven alone
were killed by this surge, which left behind floodwaters in the town for
weeks afterward.
The hurricane continued
northwestward across the Gulf of Mexico and approached Pensacola on September
20th. The storm nearly stalled to the south of Pensacola later that day and
buffeted the central Gulf Coast with 24 hours of heavy rainfall, hurricane
force winds, and storm surge. The hurricane weakened as it moved inland over
Louisiana later on the 21st. Nearly every pier, warehouse, and vessel on
Pensacola Bay was destroyed.
The great hurricane of 1926 ended the economic boom in South Florida and
would be a $90 billion disaster had it occurred in recent times. With a highly
transient population across southeastern Florida during the 1920s, the death
toll is uncertain since more than 800 people were missing in the aftermath
of the cyclone. A Red Cross report lists 373 deaths and 6,381 injuries as
a result of the hurricane.
For an
interactive
map of the Great Miami Hurricane visit the
NOAA Coastal Services Center.
Back
to the top
San Felipe-Okeechobee Hurricane
1928
 This classic Cape Verde hurricane was first
detected over the tropical Atlantic on September 10, although it likely formed
several days earlier. It moved westward through the Leeward Islands on the
12th. It then turned west-northwestward, scoring a direct hit on Puerto Rico
on the 13th (the feast of San Felipe) as a Category 4 hurricane. The hurricane
continued west-northwestward through the Bahamas and made landfall near Palm
Beach, Florida on September 16. It turned north-northeastward over the Florida
Peninsula on the 17th, a motion which brought the remains of the storm to
eastern North Carolina on the 19th. It then turned northward and merged with
a non-tropical low over the eastern Great Lakes on September 20.
This classic Cape Verde hurricane was first
detected over the tropical Atlantic on September 10, although it likely formed
several days earlier. It moved westward through the Leeward Islands on the
12th. It then turned west-northwestward, scoring a direct hit on Puerto Rico
on the 13th (the feast of San Felipe) as a Category 4 hurricane. The hurricane
continued west-northwestward through the Bahamas and made landfall near Palm
Beach, Florida on September 16. It turned north-northeastward over the Florida
Peninsula on the 17th, a motion which brought the remains of the storm to
eastern North Carolina on the 19th. It then turned northward and merged with
a non-tropical low over the eastern Great Lakes on September 20.
No reliable wind
readings are available from near the landfall area in Florida. However, Palm
Beach reported a minimum pressure of 27.43 in, making this the fourth strongest
hurricane of record to hit the United States. In Puerto Rico, San Juan reported
144 mph sustained winds, while Guayama reported a pressure of 27.65 inches.
Additionally, a ship just south of St. Croix, United States Virgin Islands
(USVI) reported a pressure of 27.50 inches, while Guadeloupe in the Leeward
Islands reported a pressure of 27.76 inches.
This hurricane
caused heavy casualties and extensive destruction along its path from the
Leeward Islands to Florida. The worst tragedy occurred at inland Lake Okeechobee
in Florida, where the hurricane caused a lake surge of 6 to 9 ft that inundated
the surrounding area. 1,836 people died in Florida, mainly due to the lake
surge. An additional 312 people died in Puerto Rico, and 18 more were reported
dead in the Bahamas. Damage to property was estimated at $50,000,000 in Puerto
Rico and $25,000,000 in Florida.
For an
interactive
map of the San Felipe-Okeechobee Hurricane visit the
NOAA Coastal Services
Center.
Back
to the top
Florida Keys Labor Day Hurricane
1935
 This system was first detected east of the
central Bahamas on August 29. Moving westward, it passed near Andros Island
on September 1, at which time it reached hurricane strength and turned
west-northwestward. Phenomenal strengthening then occurred, and when the
storm reached the middle Florida Keys on September 2, it was a Category 5
hurricane. After roaring through the Keys, the hurricane turned gradually
northward almost parallel to the Florida west coast until it again made landfall
near Cedar Key as a Category 2 hurricane on the 4th. A northeastward motion
took the storm across the southeastern United States to the Atlantic coast
near Norfolk, Virgina on September 6. It continued into the Atlantic, becoming
extratropical on the 7th and last being detected on the 10th.
This system was first detected east of the
central Bahamas on August 29. Moving westward, it passed near Andros Island
on September 1, at which time it reached hurricane strength and turned
west-northwestward. Phenomenal strengthening then occurred, and when the
storm reached the middle Florida Keys on September 2, it was a Category 5
hurricane. After roaring through the Keys, the hurricane turned gradually
northward almost parallel to the Florida west coast until it again made landfall
near Cedar Key as a Category 2 hurricane on the 4th. A northeastward motion
took the storm across the southeastern United States to the Atlantic coast
near Norfolk, Virgina on September 6. It continued into the Atlantic, becoming
extratropical on the 7th and last being detected on the 10th.
No wind measurements
are available from the core of this small, but vicious hurricane. However,
a pressure of 26.35 inches measured at Long Key, Florida makes this the most
intense hurricane of record to hit the United States and the second most
intense hurricane of record in the Atlantic basin (surpassed only by the
26.22 inches observed in Hurricane Gilbert in 1988).
The combination
of winds and tides were responsible for 408 deaths in the Florida Keys, primarily
among World War I veterans working in the area. Damage in the United States
was estimated at $6 million.
For an
interactive
map of the Labor Day Hurricane visit the
NOAA Coastal Services Center.
Back
to the top
New England Hurricane
1938
 The "Long Island Express" was first
detected over the tropical Atlantic on September 13, although it may have
formed a few days earlier. Moving generally west-northwestward, it passed
to the north of Puerto Rico on the 18th and 19th, likely as a category 5
hurricane. It turned northward on September 20 and by the morning of the
21st it was 100 to 150 miles east of Cape Hatteras, North Carolina. At that
point, the hurricane accelerated to a forward motion of 60 to 70 mph, making
landfall over Long Island and Connecticut that afternoon as a Category 3
hurricane. The storm became extratropical after landfall and dissipated over
southeastern Canada on September 22.
The "Long Island Express" was first
detected over the tropical Atlantic on September 13, although it may have
formed a few days earlier. Moving generally west-northwestward, it passed
to the north of Puerto Rico on the 18th and 19th, likely as a category 5
hurricane. It turned northward on September 20 and by the morning of the
21st it was 100 to 150 miles east of Cape Hatteras, North Carolina. At that
point, the hurricane accelerated to a forward motion of 60 to 70 mph, making
landfall over Long Island and Connecticut that afternoon as a Category 3
hurricane. The storm became extratropical after landfall and dissipated over
southeastern Canada on September 22.
Blue Hill Observatory,
Massachusetts measured sustained winds of 121 mph with gusts to 183 mph (likely
influenced by terrain). A U.S. Coast Guard station on Long Island measured
a minimum pressure of 27.94 in. Storm surges of 10 to 12 ft inundated portions
of the coast from Long Island and Connecticut eastward to southeastern
Massachusetts, with the most notable surges in Narragansett Bay and Buzzards
Bay. Heavy rains before and during the hurricane produced river flooding,
most notably along the Connecticut River.
This hurricane
struck with little warning and was responsible for 600 deaths and $308 million
in damage in the United States.
For an
interactive
map of the New England Hurricane visit the
NOAA Coastal Services
Center.
Back
to the top
Great Atlantic Hurricane
1944
 This large and powerful hurricane was first
detected northeast of the Leeward Islands on September 9. It moved
west-northwestward through the 12th, then turned northward on a track that
brought the center near Cape Hatteras, North Carolina on the 14th. The cyclone
accelerated north-northeastward, moving across eastern New England and into
Canada by September 15. The storm became extratropical over Canada and finally
merged with a larger low near Greenland on September 16. This hurricane was
of Category 3 intensity at landfalls at Cape Hatteras, Long Island, and Point
Judith, Rhode Island, and Category 2 as far north as the coast of Maine.
This large and powerful hurricane was first
detected northeast of the Leeward Islands on September 9. It moved
west-northwestward through the 12th, then turned northward on a track that
brought the center near Cape Hatteras, North Carolina on the 14th. The cyclone
accelerated north-northeastward, moving across eastern New England and into
Canada by September 15. The storm became extratropical over Canada and finally
merged with a larger low near Greenland on September 16. This hurricane was
of Category 3 intensity at landfalls at Cape Hatteras, Long Island, and Point
Judith, Rhode Island, and Category 2 as far north as the coast of Maine.
Cape Henry, VA
reported 134 mph sustained winds (measured 90 ft above the ground) with estimated
gusts to 150 mph. Widespread hurricane-force winds were reported elsewhere
along the storm track from North Carolina to Massachusetts with a maximum
reported gust of 109 mph at Hartford, Connecticut. Rainfall totals of 6 to
11 inches accompanied the storm.
While this hurricane
caused 46 deaths and $100 million in damage in the United States, the worst
effects occurred at sea where it wreaked havoc on World War II shipping.
Five ships, including a U. S. Navy destroyer and minesweeper, two U. S. Coast
Guard cutters, and a light vessel, sank due to the storm causing 344
deaths.
For an
interactive
map of the Great Atlantic Hurricane visit the
NOAA Coastal Services
Center.
Back
to the top
Hurricanes Carol and Edna
1954

 Carol formed near the central Bahama Islands
on August 25, and moved slowly northward and north-northwestward. By August
30 it was a hurricane about 100-150 miles east of Charleston, South Carolina.
It then accelerated north-northeastward, make landfall as a Category 3 hurricane
over Long Island, New York and Connecticut on the 31st. The cyclone became
extratropical later that day as it crossed the remainder of New England and
southeastern Canada.
Carol formed near the central Bahama Islands
on August 25, and moved slowly northward and north-northwestward. By August
30 it was a hurricane about 100-150 miles east of Charleston, South Carolina.
It then accelerated north-northeastward, make landfall as a Category 3 hurricane
over Long Island, New York and Connecticut on the 31st. The cyclone became
extratropical later that day as it crossed the remainder of New England and
southeastern Canada.
Sustained winds
of 80 to 100 mph were reported over much of eastern Connecticut, all of Rhode
Island, and eastern Massachusetts. A peak gust of 130 mph was reported at
Block Island, Rhode Island, while gusts of 100 to 125 mph occurred over much
of the rest of the affected area. Storm surge flooding occurred along the
New England coast from Long Island northward, with water depths of 8 to 10
ft reported in downtown Providence, Rhode Island. Carol was responsible for
60 deaths and $461 million in damage in the United States.
No discussion of
Carol is complete without mention of the remarkably similar Hurricane Edna.
This storm first formed east of the Windward Islands on September 2. It moved
northwestward, and by September 7 it was a hurricane very near where Carol
had formed two weeks before. From this point, Edna followed a path just east
of Carol's. It accelerated past Cape Hatteras, North Carolina on September
10 and made landfall over Cape Cod as a Category 3 hurricane the next day.
Edna moved across Maine into eastern Canada later on the 11th as it became
extratropical.
Martha's Vinyard,
Massachusetts reported a peak wind gust of 120 mph during Edna, and much
of the rest of the affected area had gusts of 80 to 100 mph. The storm was
responsible for 20 deaths and $40 million in damage in the United
States.
Back
to the top
Hurricane Hazel
1954
 Hazel was first spotted east of
the Windward Islands on October 5. It moved through the islands later that
day as a hurricane, then it moved westward over the southern Caribbean Sea
through October 8. A slow turn to the north-northeast occurred from October
9-12, with Hazel crossing western Haiti as a hurricane on the 12th. The hurricane
turned northward and crossed the southeastern Bahamas on the 13th, followed
by a northwestward turn on the 14th. Hazel turned north and accelerated on
October 15, making landfall as a Category 4 hurricane near the North
Carolina-South Carolina border. Subsequent rapid motion over the next 12
hours took the storm from the coast across the eastern United States into
southeastern Canada as it became extratropical.
Hazel was first spotted east of
the Windward Islands on October 5. It moved through the islands later that
day as a hurricane, then it moved westward over the southern Caribbean Sea
through October 8. A slow turn to the north-northeast occurred from October
9-12, with Hazel crossing western Haiti as a hurricane on the 12th. The hurricane
turned northward and crossed the southeastern Bahamas on the 13th, followed
by a northwestward turn on the 14th. Hazel turned north and accelerated on
October 15, making landfall as a Category 4 hurricane near the North
Carolina-South Carolina border. Subsequent rapid motion over the next 12
hours took the storm from the coast across the eastern United States into
southeastern Canada as it became extratropical.
High winds occurred
over large portions of the eastern United States. Myrtle Beach, South Carolina
reported a peak wind gust of 106 mph, and winds were estimated at 130 to
150 mph along the coast between Myrtle Beach and Cape Fear, North Carolina.
Washington, DC reported 78 mph sustained winds, and peak gusts of over 90
mph occurred as far northward as inland New York state. A storm surge of
up to 18 ft inundated portions of the North Carolina coast. Heavy rains of
up to 11 inches occurred as far northward as Toronto, Canada resulting in
severe flooding.
Hazel was responsible
for 95 deaths and $281 million in damage in the United States, 100 deaths
and $100 million in damage in Canada, and an estimated 400 to 1000 deaths
in Haiti.
Back
to the top
Hurricanes Connie and Diane
1955


